

 5187
5187
Introduction
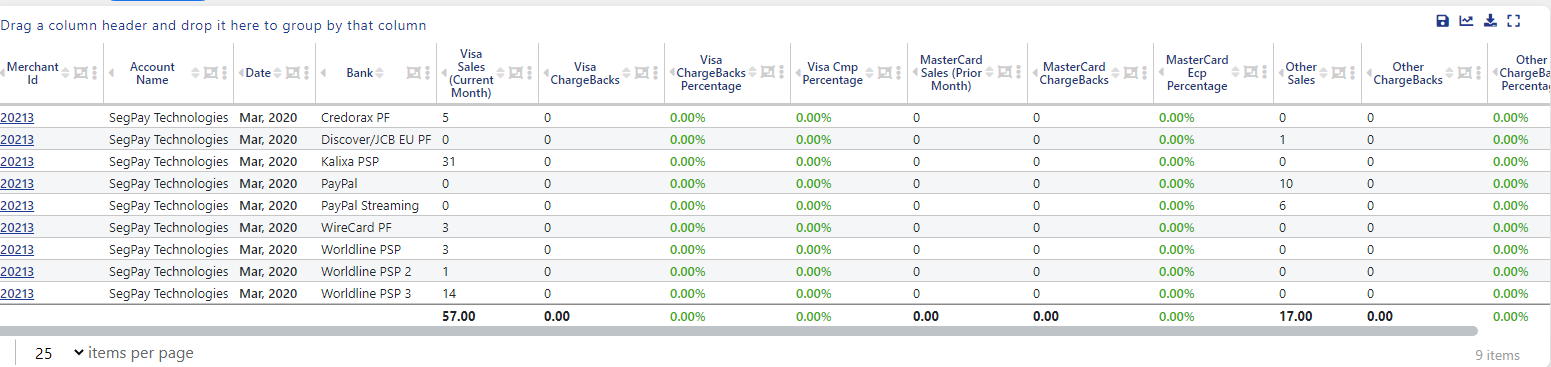
This report allows you to see your total number of chargebacks, as well as your chargeback rate, during a specific time period. The report shows your chargeback counts/rates for Visa and Mastercard transactions, as well as overall.
Run a Report
Follow these steps to run the Chargeback Rates report:
- Login to the Segpay Merchant Portal at: https://mp.segpay.com, and point your mouse at the Financial Details menu. Select Chargeback Report.

The following steps will help you generate a report with the data you want.
Click Choose from a Saved Report if you have run the Chargeback Rates report before and want to retrieve a specific report you’ve run previously, so you don’t have to re-create it (see the Saved Reports section near the end of this document for more detail). Otherwise, see step 2 below to generate a new report.

- First, click the date-selector box on the left and choose the start month for your report. Then choose the ending month in the date-selector box on the right:

- Next, select the merchant account(s) you want to see in the report (assuming you have more than one). Notice the search box, which comes in handy if you have a long list of merchants to scroll through.

- Choose whether you want dates in your report to reflect the actual date, which Visa and Mastercard use to determine compliance with their chargeback monitoring programs; or the invoiced date, when the chargebacks were reported in the Segpay system (and which will match your invoices).

- Click Generate Report. By default, results are sorted reverse-chronologically by date. Each row represents a specific month during the date range you selected, and displays the number of sales and chargebacks you had during that month – broken out by Visa, Mastercard and “Other” credit card types (which include JCB and Discover, for example) – along with the chargeback percentage.
Notes:
- Mastercard ECP (Excessive Chargeback Program) Percentage = number of Mastercard chargebacks for the current month divided by number of Mastercard sales in the prior month. For example, if you are viewing data for February 2018, the percentage is based on chargebacks in February divided by sales in January.
- Visa CMP (Chargeback Monitoring Program) Percentage differs from total Visa Chargeback Percentage in that Visa CMP caps chargebacks at 10/month per card for each merchant account. Example:
- 1,000 Visa sales in February
- 24 total chargebacks on one merchant account in February
- 15 chargebacks from one specific credit card and 9 from a second card
- Visa Chargeback Percentage = 24/1,000 or 2.4%. This is your actual chargeback rate.
- Visa CMP Percentage = 19/100 or 1.9%. This is the chargeback rate Visa uses to evaluate you.
Customize a Report
Choose from a Saved Report
 Most reports have four small icons in the top right corner. The one shaped like a floppy lets you save your report filter choices so that you can easily retrieve them later.
Just click the icon and type in a name to use when retrieving your report filter. If you choose the same name again it will let you overwrite the old filter. You can also rename and delete your filters.


When you are ready to use your filter just click ‘Choose from a saved report’ to pull up your saved filter. This can save you time if you run the same report many times. Note saved reports save filters but do not save groupings.
 Download my Report
To download your report choose the icon in the top right that looks like a down arrow.

Then give your report a name and choose the format for your download (CSV,XSLX,PDF) and click the download button.
On some reports that return thousands of rows of data you will be given some additional choices for your download. You will see an option to have your report emailed to you.
Large reports may be emailed to you in a zip archive format. Very large reports (usually in PDF format) can require the zip archive to be split into multiple emails for delivery. Save all attachments to the same folder and open the first one and it will un-compress them together into a single large file.
Report Charts
In the top right corner of your report you will see several small icons. The icon with the waving arrow will allow you to see a chart view of your report.

When viewing each chart type you can use the other dropdown filters to change the way your chart data is represented on the page. Experiment with different options to see which gives you the best view for that chart type.


Result Table Filtering in your Report
Your report data is returned in a tabular grid format. There are several useful controls built into this grid for filtering and sorting your data.


Page Controls and both Horizontal and Vertical Scroll Bars will help you to see data that is too large to fit on the screen.

Use the arrows to advance to a certain page or go all the way to the last page. You can also control how many items display on a single page. Totals are shown to the right.
Please feel free to let us know any thoughts or suggestions you have about this report or anything else, by emailing [email protected].

