

 3040
3040
Introduction
The Transaction Summary report is a great way to see how your business has performed over a specific time period. The report gives you a day-by-day summary of your sales and/or reversals during the selected period.
Note that, unlike our Transaction Detail report, the Summary report does not include test transactions.
Just follow the steps below to see how many sales and/or reversals you had on each day, alongside the monetary value, during a selected time frame.
Run a Report
Follow these steps to run the Transaction Summary report:
- Login to the Segpay Merchant Portal at: https://mp.segpay.com, and select Transaction Summary Report in the top navigation area.

Click Choose from a Saved Report if you have run the Transaction Summary before and want to retrieve a previously-run report (see the Saved Reports section near the end of this document for more detail). Otherwise, see step 2 below to generate a new report.

- Click the date-selector box and choose the time period you want to report on. Select Today, Yesterday, This Week (the current Sunday-Saturday period), Last 7 Days, This Month, Last Month (the previous calendar month), Last 30 Days. Or choose a Custom Range by selecting starting and ending dates:

- Next, select the specific merchant account(s) you want to see in the report. If you have a long list of merchant accounts, type in the first few digits to find a specific account in the list.

- Select which specific Cash program(s) you want included in the report. Cash programs group your websites together by affiliate program so it may be easier for you to report by cash program instead of selecting URLs (in the next step).

- Select the types of transactions you want included in the report: Sales, Reversals or All.

Sales include the following specific transaction types:
- Signups
- Conversions
- Instant Conversions
- Delayed Captures
- Rebills
- One Clicks
Reversals include:
- Refunds
- Voids
- Chargebacks
- Revokes
- Declines – two types: Raw and Unique:
- Raw: A count of all attempts that resulted in a decline. Example: a consumer is declined twice in successive attempts, and the payment goes through on the third try. The initial two declines are counted here.
- Unique: In the example above, no decline is counted here since the transaction was ultimately approved.
- Click the URL(s) menu to see a list of your websites. All sites associated with the Cash program(s) you selected in step 4 are selected by default, but you can add or remove specific sites. Note the Search box, which makes it easier to find a specific site if you have a large list.

- Select the currency(ies) of the transactions you want to see in the report. For example, if you accept payment in EUR and USD, you can generate a report with only the USD transactions, or select all to see everything in one report.
Note that if you select multiple currencies here, the totals at the bottom of your report will reflect a blended total of all currencies. Select one currency at a time to see true totals for each.

- Click Generate Report. By default, results are sorted reverse-chronologically by date. Each row represents a specific date, Merchant account (MID) and currency, and displays the number of transactions, and monetary value, generated on that date. Click on any $ or # column header to sort the report by total count (#) or total value ($) for that specific transaction type.

Customize Report Results
Many of our reports feature similar navigation filters and controls. Sometimes one control may change slightly for example the date control on one report may let you select a date range while on another report it may only allow you to select a month. Here are a few examples of some of the most common form controls.
Selecting Dates on a Report
Most reports use the same dropdown date selector component. It allows you select a date range by selecting first the ‘from’ date and then the ‘to’ date with your mouse and clicking the Apply button. Alternative you can use the quick select buttons to the left to select ‘this week’ , ‘this month’ etc.

Many reports have similar elements that can be used to customize the report. See below for some sample elements that are available in this report. Note screen shots may not be an exact match for the data returned on this report.

Most reports have four small icons in the top right corner. The one shaped like a floppy lets you save your report filter choices so that you can easily retrieve them later.
Just click the icon and type in a name to use when retrieving your report filter. If you choose the same name again it will let you overwrite the old filter. You can also rename and delete your filters.


When you are ready to use your filter just click ‘Choose from a saved report’ to pull up your saved filter. This can save you time if you run the same report many times. Note saved reports save filters but do not save groupings.

Download my Report
To download your report choose the icon in the top right that looks like a down arrow.

Then give your report a name and choose the format for your download (CSV,XSLX,PDF) and click the download button.
On some reports that return thousands of rows of data you will be given some additional choices for your download. You will see an option to have your report emailed to you.
Large reports may be emailed to you in a zip archive format. Very large reports (usually in PDF format) can require the zip archive to be split into multiple emails for delivery. Save all attachments to the same folder and open the first one and it will un-compress them together into a single large file.
Report Charts
In the top right corner of your report you will see several small icons. The icon with the waving arrow will allow you to see a chart view of your report.
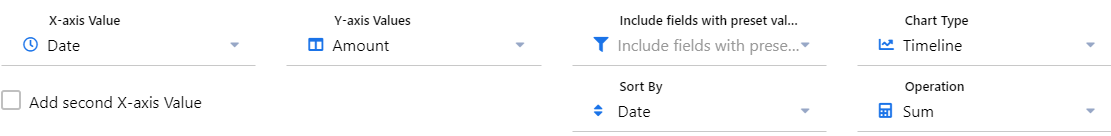
When viewing each chart type you can use the other dropdown filters to change the way your chart data is represented on the page. Experiment with different options to see which gives you the best view for that chart type.


Result Table Filtering in your Report
Your report data is returned in a tabular grid format. There are several useful controls built into this grid for filtering and sorting your data.


Page Controls and both Horizontal and Vertical Scroll Bars will help you to see data that is too large to fit on the screen.

Use the arrows to advance to a certain page or go all the way to the last page. You can also control how many items display on a single page. Totals are shown to the right.
Please feel free to let us know any thoughts or suggestions you have about this report or anything else, by emailing [email protected].

